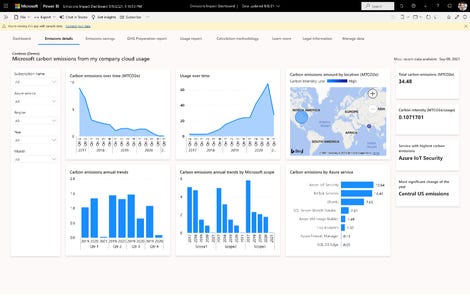
Microsoft has announced that its Emissions Impact Dashboard tool will now be widely available after previously helping certain Microsoft cloud customers understand, track, analyze and reduce the carbon emissions associated with their cloud usage.
In a blog post, Microsoft general manager of global industry product marketing Kees Hertogh said the tool had been renamed and now allows customers to measure the impact of Microsoft cloud usage on a company's carbon footprint and drill down into emissions by month, service, and datacenter region.
The tool also lets users enter unmigrated workloads and get an estimate of emissions savings from migrating to the Microsoft cloud while also giving users a chance to calculate and understand the carbon impact of cloud workloads across scope 3 emissions.
"As cloud services continue to scale, their impact on the environment cannot be overlooked. That's why today we're announcing the general availability of the Microsoft Emissions Impact Dashboard, a tool that helps Microsoft cloud customers understand, track, report, analyze and reduce carbon emissions associated with their cloud usage," Hertogh said.
"The Emissions Impact Dashboard is part of our commitment to address our own environmental impact and help our customers do the same. We introduced the Emissions Impact Dashboard in January 2020 as the Microsoft Sustainability Calculator. Designed to help customers gather meaningful, shareable information, the Emissions Impact Dashboard gleans critical insights to help organizations make more informed, data-driven decisions about sustainable computing."

Hertogh explained that the tool was built to provide customers with transparency about the greenhouse gas emissions that come with any usage of Microsoft cloud services.
As years have gone by, Microsoft has updated the tool to calculate Scope 3 emissions associated with Microsoft cloud usage, which are "indirect and occur across the product value chain — from materials extraction and manufacturing to transport, usage and hardware disposal."
"Scope 3 activities are often the largest source of emissions, but they can be difficult to measure. Using our third-party validated methodology for carbon accounting, the Emissions Impact Dashboard provides a broad understanding of the carbon impact of cloud workloads across scopes," Hertogh added.
"This allows for more complete and accurate emissions reporting and better decisions about sustainability. RELX, the information and analytics group, has been using the Emissions Impact Dashboard during preview for the last six months. Sustainability is a priority for RELX, and the tool now forms one of the key components of its CO2.Hub, the Azure-based solution it has built using Power BI to measure its Scope 1, 2 and 3 emissions."
This week, Google announced a similar tool that will provide its cloud users with data about their carbon footprint.
"impact" - Google News
October 13, 2021 at 10:00PM
https://ift.tt/3p0hFee
Microsoft announces expansion of Emissions Impact Dashboard - ZDNet
"impact" - Google News
https://ift.tt/2RIFll8
https://ift.tt/3fk35XJ
Bagikan Berita Ini


0 Response to "Microsoft announces expansion of Emissions Impact Dashboard - ZDNet"
Post a Comment