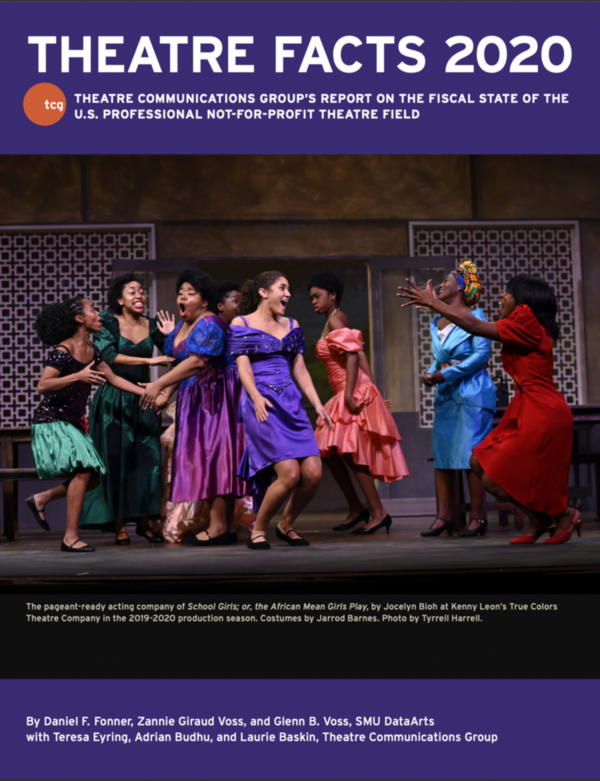
NEW YORK CITY: Theatre Communications Group (TCG), in partnership with SMU DataArts, has released Theatre Facts 2020. Theatre Facts, which is based on TCG’s fiscal survey and SMU DataArts’ Cultural Data Profile (CDP), is the only in-depth report examining the attendance, performance, and overall fiscal state of the U.S. professional nonprofit theatre field. This year’s survey, which covers the period from Oct. 1, 2019, to Sept. 30, 2020, shows that even amid a foreshortened season, nonprofit theatres contributed nearly $2.1 billion to the U.S. economy and attracted 23 million attendees.

“Theatre Facts 2020 provides a critical perspective on the fiscal state of our theatre ecology during the first few months of the COVID-19 pandemic,” said TCG executive director Teresa Eyring in a statement. “Theatres were able to offset some of their lost ticket income through significant increases in individual giving and government support—both signs that theatres remain deeply valued parts of their communities. By also reducing expenses, theatres were able to keep their bottom line, measured as Change in Unrestricted Net Assets (CUNA), positive for the fifth year in a row. However, that reduction in expenses came at the painful cost of a workforce reduction. While these losses of the past year have been significant, the report also speaks to the resilience and innovative nature of our theatre ecology. We’re not out of the pandemic yet, but Theatre Facts 2020 underlines the many strengths that theatres will draw upon as they continue to reopen.”
The full Theatre Facts 2020 report is available here. It is broken into an executive summary followed by data presented in the following three ways:
- The Universe: a broad overview of the estimated 1,422 U.S. professional not-for-profit theatres
- Trend Theatres: a longitudinal analysis of the 152 theatres that participated in either the TCG Fiscal Survey or CDP each year from 2016 to 2020.
- Profiled Theatres: a detailed examination of all 206 theatres that completed a CDP in 2020, with data broken out into six budget categories based on annual expenses.
“These findings shed light on how the theatre field’s finances and operations were impacted at the very start of the pandemic,” said SMU DataArts director Zannie Giraud Voss in a statement. “Future iterations of this report will reveal extended pandemic-related impacts as well as provide data to inform the rebuilding and reimagining of the theatre field through an equitable lens to ensure all are welcomed and supported in the theatre for years to come.”
Unless otherwise noted, the financial changes reported below reflect average, inflation-adjusted figures for the Trend Theatres for the 5-year period from 2016 to 2020. Key findings include:
- Average 5-year earned income rose annually, then fell in 2020. The result was a five-year decrease exceeding inflation by 13 percent. Average single ticket income was 33 percent lower in 2020 than in 2016, and 40 percent lower than 2019. Subscription income fell by 29 percent over the trend period, with a five-year high coming in 2019. Total ticket income fell by 31 percent, a 36 percent drop from 2019 into 2020.
- All levels of government support were at their five-year peak in 2020, with some of that growth potentially explained by COVID-19 relief funding. Federal funding in particular ended the trend period 181 percent above the 2016 level following a five-year low in 2019.
- Average contributed income from other individuals (non-trustees) grew 46 percent over the five-year trend period, including a 37 percent increase from 2019.
- The average theatre’s budget size shrank by 12 percent from 2019 to 2020. The largest shift was a 2020 cut in general and management personnel expenses, which was nearly half of its 2019 level.
- Working capital improved to a five-year high in 2020. Over half of trend theatres in 2016 had negative working capital, which dropped to 39 percent of theatres in 2020.
Theatre Communication Group’s Theatre Facts 2020 was written by Zannie Giraud Voss, professor and director of SMU DataArts at Southern Methodist University (SMU); Glenn B. Voss, professor emeritus and SMU DataArts research director; Daniel Fonner, associate director for research, SMU DataArts; Adrian Budhu, deputy director and COO, TCG; Teresa Eyring, executive director and CEO, TCG; and Laurie Baskin, director of Research, Policy & Collective Action, TCG.
For further information on the changes experienced by the field between 2016 and 2020, and on differences in income, attendance, and expenses among theatres of various sizes, see the Trend Theatres and Profiled Theatres sections of the full Theatre Facts 2020 report, available here.
"impact" - Google News
December 02, 2021 at 02:54AM
https://ift.tt/3ofkzL2
Theatre Facts 2020 Report Shows COVID's Initial Impact - American Theatre
"impact" - Google News
https://ift.tt/2RIFll8
https://ift.tt/3fk35XJ
Bagikan Berita Ini


0 Response to "Theatre Facts 2020 Report Shows COVID's Initial Impact - American Theatre"
Post a Comment