Biodiversity benefits humanity in many ways.
It helps make the global economy more resilient, it functions as an integral part of our culture and identity, and research has shown it’s even linked to our physical health.
However, despite its importance, Earth’s biodiversity has decreased significantly over the last few decades. In fact, between 1970 and 2016, the population of vertebrate species fell by 68% on average worldwide. What’s causing this global decline?
Today’s graphic uses data from WWF’s Living Planet Report 2020 to illustrate the biggest threats to Earth’s biodiversity, and the impact each threat has had globally.
Measuring the Loss of Biodiversity
Before looking at biodiversity’s biggest threats, first thing’s first—how exactly has biodiversity changed over the years?
WWF uses the Living Planet Index (LPI) to measure biodiversity worldwide. Using data from over 4,000 different species, LPI tracks the abundance of mammals, birds, fish, reptiles, and amphibians across the globe.
Here’s a look at each region’s average decline between 1970 and 2016:
| Rank | Region | Average decline (between 1970 and 2016) |
|---|---|---|
| 1 | Latin America & Caribbean | 94% |
| 2 | Africa | 65% |
| 3 | Asia Pacific | 45% |
| 4 | North America | 33% |
| 5 | Europe and Central Asia | 24% |
Latin America & Caribbean has seen the biggest drop in biodiversity at 94%. This region’s drastic decline has been mainly driven by declining reptile, amphibian, and fish populations.
Despite varying rates of loss between regions, it’s clear that overall, biodiversity is on the decline. What main factors are driving this loss, and how do these threats differ from region to region?
Biggest Threats to Biodiversity, Overall
While it’s challenging to create an exhaustive list, WWF has identified five major threats and shown each threats proportional impact, averaged across all regions:
| Threat | Proportion of threat (average across all regions) |
|---|---|
| Changes in land and sea use | 50% |
| Species overexploitation | 24% |
| Invasive species and disease | 13% |
| Pollution | 7% |
| Climate Change | 6% |
Across the board, changes in land and sea use account for the largest portion of loss, making up 50% of recorded threats to biodiversity on average. This makes sense, considering that approximately one acre of the Earth’s rainforests is disappearing every two seconds.
Species overexploitation is the second biggest threat at 24% on average, while invasive species takes the third spot at 13%.
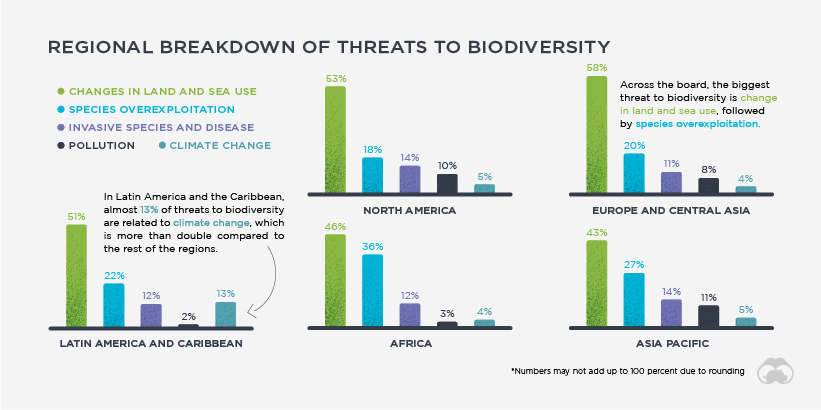
Biggest Threats to Biodiversity, By Region
When looking at the regional breakdown, the order of threats in terms of biodiversity impact is relatively consistent across all regions—however, there are a few discrepancies:

In Latin America and Caribbean, climate change has been a bigger biodiversity threat than in other regions, and this is possibly linked to an increase in natural disasters. Between 2000 and 2013, the region experienced 613 extreme climate and hydro-meteorological events, from typhoons and hurricanes to flash floods and droughts.
Another notable variation from the mean is species over-exploitation in Africa, which makes up 35% of the region’s threats. This is higher than in other regions, which sit around 18-27%.
While the regional breakdowns differ slightly from place to place, one thing remains constant across the board—all species, no matter how small, play an important role in the maintenance of Earth’s ecosystems.
Will we continue to see a steady decline in Earth’s biodiversity, or will things level out in the near future?
"impact" - Google News
November 29, 2020 at 02:44AM
https://ift.tt/3qbi6Af
Visualizing the Human Impact on the Earth's Surface - Visual Capitalist
"impact" - Google News
https://ift.tt/2RIFll8
https://ift.tt/3fk35XJ
Bagikan Berita Ini


0 Response to "Visualizing the Human Impact on the Earth's Surface - Visual Capitalist"
Post a Comment